Performance analysis as a crime novel
I love digging into weird problems and edge cases - bugs, performance issues, or decompiling some undocumented library to understand how it works.
In my opinion, developers usually prefer to work on creating new features from scratch. Bugfixing and investigation is tedious work, but for me the payoff is worth it. I get to play detective for a while and rejoice when I’ve solved an imaginary crime.
The job
A client contacted me with a problem:
We have a WPF desktop app, similar to Google Maps. It runs on AWS AppStream.
If the users pan too quickly around the map, the app drops frames, lags and feels choppy.
Our developers checked with a profiler, did memory dumps, hot paths checks and pinpointed the problem to the code of a 3rd-party map component vendor.
We’ve talked to the vendor, but they didn’t come back with a solution.
I was reluctant to look into the issue. Good developers profiled the app. The component vendors didn’t know (or didn’t have the time to check) what caused the performance drop on their end. What more could I do?
After some deliberation on my side, we agreed that I’ll investigate for a couple of hours. If I came up with any new feedback, great.
The plan
Staying true to my thoughts on how debugging should work, I wanted to plan out a hypothesis and test it out.
- I had no idea what AWS AppStream is, so I had to research that first.
- Read the documentation of the sample app, go through the communication with the vendor, emails, etc.
- Reproduce the issue, cut it down to a single test scenario with clear steps.
- Profile the app in various ways.
- ???
- Write down everything I find and send it back to my client.
The investigation
What would a detective dо? Read the case files and go visit the scene of the crime.
AWS AppStream’s docs explained it as a sort of restricted virtual desktop environment. Simplified, the server renders the application and sends the pixels over the network to the user. Somewhat similar to VNC, Remote Desktop, TeamViewer, AnyDesk, etc.
Maybe it’s a network issue?
My first thought was the stream gets messed up. Bad network connection, users have trouble panning the map, maybe app waits on network I/O, maybe it drops frames.
Well, no. After reading the support tickets, the client dev team had checked this. The route between AWS and the users was working well. Same as the route between the users and the map tile server.
That was good for me. I didn’t need to setup my own instance of AppStream. That would have taken too much time and effort.
Scene of the crime
I managed to compile and run the provided sample application. If I couldn’t do that, at least I’d have enough time to get help from the client’s devs about running the app.
Load an empty map, pan around quickly in a circle, and there it was - the performance drop was noticeable. We have a victim.
One thing bothered me - the perf drop was obviously there, especially with Google Maps side-by-side. But it wasn’t a blocker or something that would annoy me as a user. Was my hardware too good?
I have a beefy machine: 32GB RAM, AMD ThreadRipper 2950X and a Radeon RX Vega 64 8GB GPU, and 3 large monitors (2560 x 1440). Not top-of-the-line anymore, but still way off from a common low-spec machine, or some underpowered server.
So how could I get closer to user-spec hardware? If I could get the app to render for longer, any dropped frames would be more visible, and show longer timings in a profiler.
Walking thoughtfully along the pier
This was a great time to step away from the computer, eat and do some brainstorming.
I thought along the lines of What causes frame drops and freezes?
- Doing too much work in a small amount of time. Obvious in CPUs and GPUs with low frequencies, not enough cores or RAM. The hardware doesn’t have enough resource to process all that code and rendering data fast enough.
- Drawing on big surfaces/resolutions. The bigger a rendering surface is, the more data needs to be processed.
- No optimizations in the app’s code.
- UI thread doing too much work or waiting on a resource.
I saw several approaches:
- Find a low-spec machine, run the app there and analyze with a remote profiler.
- Run the app in a virtual machine, use a remote profiler again.
- Stress-test my machine while running the app and hope the app’s UI thread doesn’t get enough running time to do its work.
I’d build the app in Debug mode in all cases. I don’t need any optimizations, at least not in the initial few tests.
#1 would be too costly, I’ve thrown away most of my old machines and finding a new one would take some time. What type of hardware should I even be looking for?
#2 was an easy one, but I had to create a new Windows 10 virtual machine, which meant downloading an ISO, installing, etc. It would also take a few hours. I started the download and moved to #3.
#3 was the most accessible. I had already installed tools like prime95 and Cinebench that would torment my hardware. I had big enough screens (3 x 1440p) to maximize the app’s drawing area.
Then it dawned on me. I could do all of the above!
Found the weapon
What if I combined all of my displays in one, via AMD’s driver software? That would make a huge 6560 x 1440 drawing area when the app is maximized. I could lower the GPU clock speed to slow it down even further.
I could also throttle my CPU. When laptops get too hot, the system throttles down the CPU to make it do less work, but keep the CPU cooler. How would I do it on my desktop machine?
New plan - do all of the above, run the stress-testing software, run the app and hopefully I’d see a nice laggy application that produces long timings in the profiler.
Combining the displays was easy. Throttling down the CPU took some searching. I knew Windows supports setting custom power management options on the CPU, but I hadn’t thought of lowering the percentages so low.
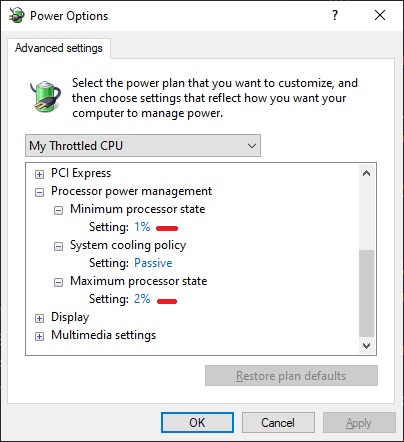
I set the CPU to run on 1-2% of its maximum. Saved that as a new power profile, in case I need it again. Running full-screen and testing the same steps as before increased the perceived performance drop. Now using the app (and Windows) was quite irritating.
Following the suspect
I ran DotTrace, Windows Performance Analyzer and UI for ETW.
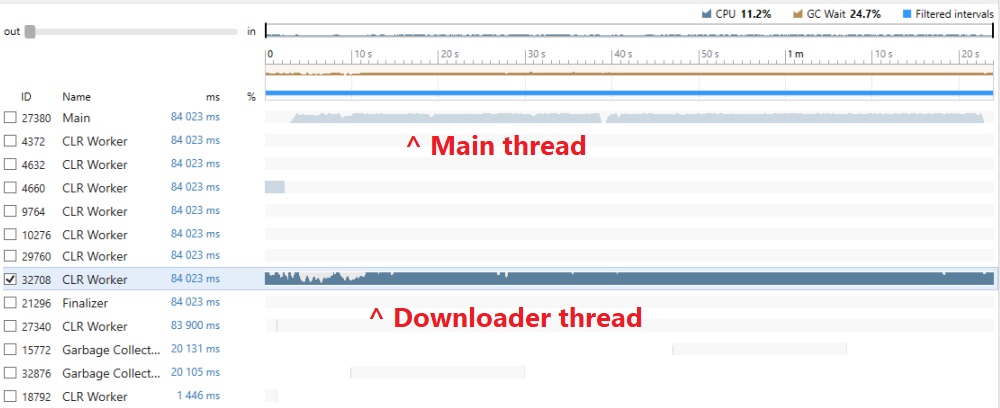
Both profilers showed two active threads when interacting with the map. The main thread is where rendering happens in WPF. Other threads are generally used for offloading CPU intensive work, downloads, waiting on I/O, etc. This is done so that the main thread has more free time for rendering and processing user input. The second thread in this case was named “DownloaderThread” in the code. You’ll see why.
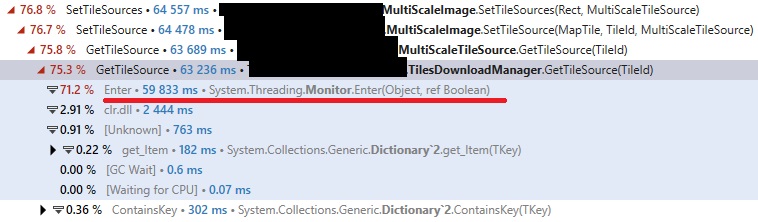
I opened the main thread first, expecting to see a method that was called too many times, or does an expensive computation. There was one: TilesDownloadManager.GetTilesSource. That’s probably where the issue would be.
However, that’s not the actual hotspot. GetTilesSource is just user code that spends a lot of time waiting on a system method called System.Threading.Monitor.Enter(). This is the method behind C#’s lock keyword, used to synchronize access between multiple threads to a shared resource.
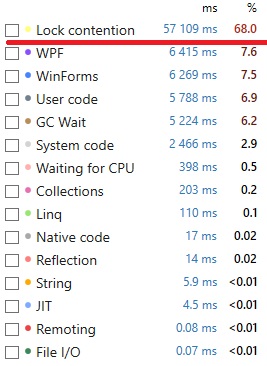
Looking into DotTrace’s subsystems, I confirmed that’s the case. The main thread spends 68% of its time blocked on a lock, instead of rendering. Given there were only two active threads, the main thread probably waited on the downloader thread.
So what is the downloader thread doing?
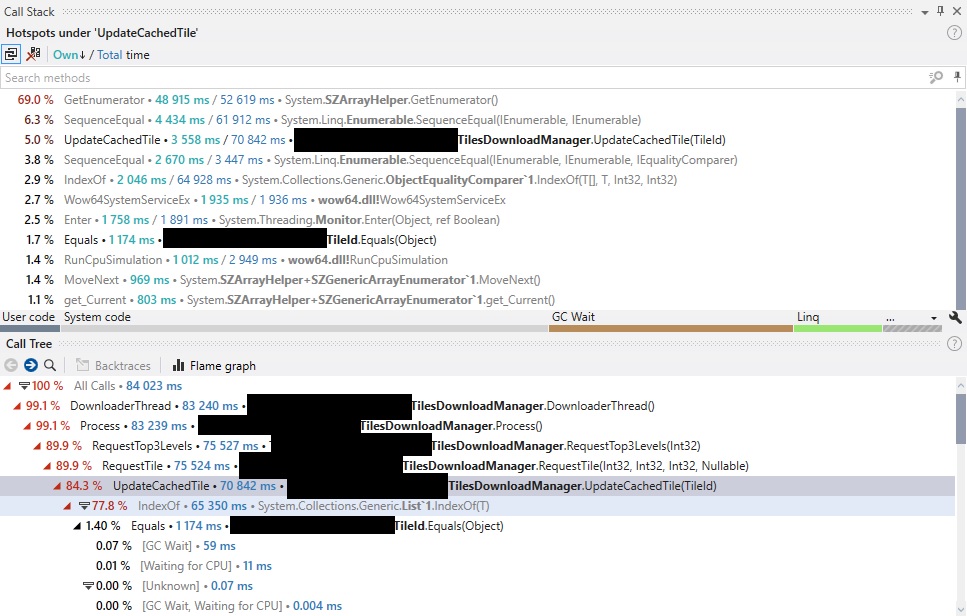
Note three main things:
- The Call Tree shows
UpdateCachedTileas the biggest offender, before dropping to system code. - A lot of time in that method is spent in
List<T>.IndexOf(). - The Call Stack for
UpdateCachedTileshows almost 70% of the time goes inSZArrayHelper.GetEnumerator()andEnumerable.SequenceEqual().
I’ll get back to the system methods in the last two points, but for now let’s focus on UpdateCachedTile.
lock and loaded
I was on to something. The main thread blocks while “getting the tile source”, and the downloader thread tries to “update a cached tile”.
What are tiles? Tiles are parts of a map that you get when you chop it up into squares. It’s convenient to have the user download the visible part of the map as a set of tiles, rather than the whole map as one. Imagine zooming at streets in New York, but having to download a map of the entire Earth at street level before doing that. Not cool.
My assumption was that the map control needs to store and cache these tiles somehow. That way the map can quickly show parts of the map to the user that they’ve already seen, instead of downloading them again. If a redownload happens at some point, the cache needs to be updated accordingly.
There could be a potential race condition if the UI thread wants to access a tile while it’s downloading in another thread. This warrants the use of a lock to protect the shared data.
I wanted to verify my hunch, so I checked the source code for both GetTilesSource and UpdateCachedTile.
class TilesDownloadManager
{
    private Dictionary<TileId, TileSource> requests;
    private Collection<TileId> requestList;
    private object requestsSynchronizer;

    TileSource GetTileSource(TileId tileId)
    {
        // ...
        lock (this.requestsSynchronizer)
        {
            if (this.requests.ContainsKey(tileId))
            {
                return this.requests[tileId];
            }
        }
    }

    bool UpdateCachedTile(TileId key)
    {
        // ...
        lock (this.requestsSynchronizer)
        {
            if (!this.requests.ContainsKey(key))
            {
                this.requestList.Add(key);
                this.requests.Add(key, null);
            }
            else
            {
                this.requestList.Remove(key);
                this.requestList.Add(key);
            }
        }
    }
Spot on - GetTileSource in the main thread uses the same requestSynchronizer as UpdateCachedTile in the downloader thread.
Locking on a synchronizer object is generally fine, that’s how you implement simple shared access. However, these two methods could be rewritten for more performance. At the moment they use lock + Dictionary<T> (this.requests) operations. The main thread waits for too long on Dictionary checks happening in the downloader thread.
.NET provides a thread-safe alternative to lock + Dictionary: ConcurrentDictionary. It is also optimized for reads, which is what the code does mostly.
Linear O(N) searches
Waiting too long on a lock was an obvious explanation to why the map is slow, but there were more things to explore. Next was why SZArrayHelper.GetEnumerator() was getting so much execution time in the downloader thread.
Looking at UpdateCachedTile(), there are no references to GetEnumerator, but it’s hidden well.
requests is a dictionary that maps a tile id to a tile source. When checking if a TileId exists (requests.ContainsKey()) .NET uses TileId.Equals(TileId).
This is all expected, it’s a common implementation when you want to cache instances of one class and have another class as the cache key.
So what is the implementation of TileId.Equals()?
bool Equals(object other)
{
    // ...
    return this.tileId.SequenceEqual(other.tileId);
}
Wait, why is SequenceEqual needed? It’s a method that checks if two sequences are the same, by calling Equals() element by element. This usage doesn’t sound right. Usually you just check the corresponding fields and properties on this and other. This is the constructor for TileId:
TileId(int level, int x, int y)
{
    this.tileId = new int[] { level, x, y };
}
Oh okay. The private data in TileId is stored as an array. In order to check if two TileIds are equal, we need to check if each element in both private arrays is the same.
This is part of the implementation of Enumerator.SequenceEqual:
using (IEnumerator<TSource> e1 = first.GetEnumerator())
using (IEnumerator<TSource> e2 = second.GetEnumerator())
{
    while (e1.MoveNext())
    {
        if (!(e2.MoveNext() && comparer.Equals(e1.Current, e2.Current))) return false;
    }
    if (e2.MoveNext()) return false;
}
return true;
And here is where finally GetEnumerator() pops up! No wonder it has so much execution time, it’s called for every TileId equality check. SequenceEqual is a linear O(N) search, even if it’s for just 3 elements. Multiplying this time for the thousands of tiles that a map operates on slows down things quite a bit.
But there’s more! GetEnumerator is a method on SZArrayHelper. It makes sense, because we know tileId is an array, and .NET authors would want to provide special optimizations for enumerating arrays.
Let’s look at the implementation of GetEnumerator:
internal IEnumerator<T> GetEnumerator<T>() {
    T[] _this = JitHelpers.UnsafeCast<T[]>(this);
    int length = _this.Length;
    return length == 0 ? SZGenericArrayEnumerator<T>.Empty : new SZGenericArrayEnumerator<T>(_this, length);
}
Notice how there’s a new SZGenericArrayEnumerator created on every call? This instantiation puts pressure on the .NET garbage collector to clean up. And we can verify this slowdown: 24.5% of the time in the download thread is spent in GC Wait according to DotTrace subsystems.
How do we fix this? Convert the [level, x, y] array into 3 separate private fields. This setup will use just a few if checks in TileId.Equals(), no GC pressure, no linear searches.
Slow removal
The last thing I checked was why List<T>.IndexOf() uses 77.8% of the time in UpdateCachedTile(). Looking at the code, there’s no explicit call, so it must be hidden somewhere. There’s not a lot of code in that method, but this is interesting:
this.requestList.Remove(key);
this.requestList.Add(key);
requestList is a Collection<T>, which is somewhat of a wrapper around List<T> and Collection<T>.Remove() is implemented as such:
public bool Remove(T item) {
    // ...
    int index = items.IndexOf(item);
    if (index < 0) return false;
    RemoveItem(index);
    return true;
}
Aha! Removing an element searches linearly the backing list, finds the element’s index and then removes it. This is a compounding issue when there are many elements in the request list. This further contributes to more time spent in the critical section, and the UI thread just keeps waiting and waiting.
The fix for this slowdown isn’t so clear, though. I haven’t looked enough into the tile download architecture to know if the requestList needs to remain a list. If that’s the case, maybe an auxiliary dictionary would help, so that this search isn’t O(N) but O(1). Maybe some sort of ConcurrentQueue can be used. There are a lot of possibilities that can be evaluated, but should be profiled and unit-tested to make sure there are minimal regressions.
Investigation well done
Now that the detective work is done, it’s time to go back to the office, pour a drink and watch the rain outside.
I’ve enjoyed this analysis a lot. It only took a couple of hours of work. Writing up the analysis for the client and this blog took more time than the actual investigation. The client was happy with the issues found and the proposals for fixing them. I’m happy that I found a way to throttle the performance of my machine. I also got to look into .NET’s internals, which is rare for me nowadays. Unfortunately, I don’t have any information on how and if someone implemented my suggestions.
My takeaways from this project are:
- As usual, multithreading is hard. Simple approaches can have hidden costs.
- The profiler is your best friend. Profile various scenarios often and think about the user experience in terms of performance.
- Have a methodical way of approaching analysis. There can be a lot of paths to investigate, so write everything down.
Subscribe to stannedelchev.net
Get the latest posts delivered right to your inbox
